Tag Archives: metatrader4
MetaTrader 4 Technical Indicators Explained
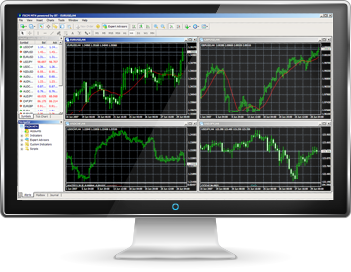
MetaTrader 4 (MT4) is a popular trading platform renowned for its comprehensive set of tools that cater to both novice and experienced traders. One of the standout features of MT4 is its wide array of technical indicators, which provide crucial insights to inform trading decisions. In this article, we’ll delve into some of the key technical indicators available on metatrader 4 for windows, explaining how they work and how they can be used effectively.
Moving Average (MA)
The Moving Average (MA) is one of the most fundamental technical indicators in trading. It smooths out price data to create a single flowing line, making it easier to identify the direction of the trend. There are different types of moving averages, such as Simple Moving Average (SMA) and Exponential Moving Average (EMA). While SMA gives equal weight to all data points in the period, EMA gives more weight to recent data, making it more responsive to new information.
How to Use:
• Trend Identification: When the price is above the MA line, it indicates an uptrend. Conversely, when the price is below the MA line, it indicates a downtrend.
• Support and Resistance: The MA can also act as a dynamic support or resistance level.
Relative Strength Index (RSI)
The Relative Strength Index (RSI) is a momentum oscillator that measures the speed and change of price movements. It oscillates between 0 and 100, providing insights into overbought or oversold conditions in a market.
How to Use:
• Overbought/Oversold: An RSI above 70 typically indicates that a market is overbought, suggesting a potential sell opportunity. An RSI below 30 indicates that a market is oversold, suggesting a potential buy opportunity.
• Divergence: Divergence between the RSI and price can indicate potential reversals. For example, if the price is making new highs while the RSI is failing to do so, it may signal a reversal.
Bollinger Bands
Bollinger Bands consist of three lines: a middle band (SMA), an upper band, and a lower band. The bands expand and contract based on market volatility, providing a visual gauge of price volatility.
How to Use:
• Volatility Measurement: When the bands are wide, it indicates high volatility; when they are narrow, it indicates low volatility.
• Trend Continuation or Reversal: A price touching the upper band suggests that the market may be overbought, while a price touching the lower band suggests that the market may be oversold. This can signal potential trend continuations or reversals.
Conclusion
Understanding and effectively using technical indicators on MetaTrader 4 can significantly enhance your trading strategy. Moving Averages help identify trends, RSI provides insights into market momentum, and Bollinger Bands offer clues about market volatility. By mastering these tools, traders can make more informed decisions, ultimately improving their chances of trading success.